Performance & Race Driving Tip
Speed Secret: Data never lies (but it doesn’t always tell you the whole story).
Data acquisition systems never lie. However, they don’t always tell the whole story. Or perhaps more accurately, it’s a challenge to dig deep enough into the data to reveal the whole story. And you need to dig deep.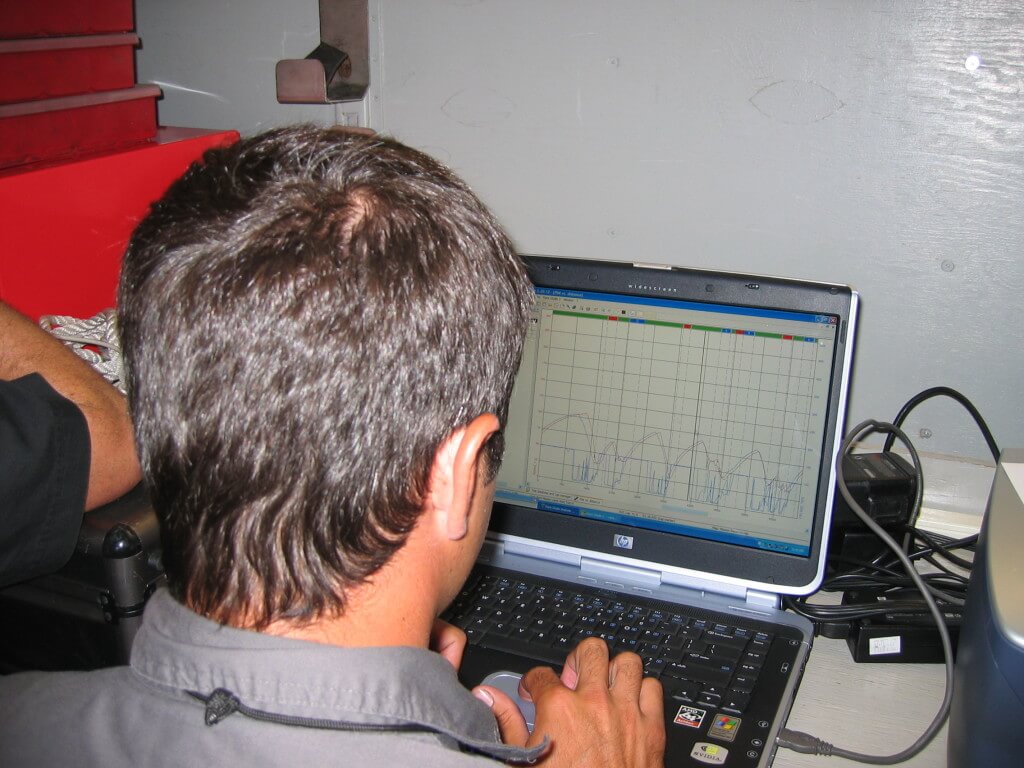
Let me share a simple example.
One of the data tools that I like to use is a throttle histogram. Simply, this is a graph that indicates what percentage of the lap is spent at various throttle positions. If, during one session on track, I’m able to spend an extra two or three percentage of the lap at full throttle, it means that I’ve made an improvement – either in my car or in my driving technique. More time spent at 100% throttle is a good thing.
But is it always?
A few years ago I was able to compare throttle histograms with a fellow driver. I was shocked! He was at full throttle for a full 7% more of the lap than I was. I spent 61% of the lap at full throttle – he was flat to the floor for 68% of the lap.
But, we had turned the same lap time, to within a couple of hundredths of a second.
So what was the full story? My competitor’s driving style was to use the throttle like an on-off switch. He was either at full throttle, or nothing. In fact, when I looked more closely at the histogram, I saw that he was at 0% throttle almost 14% more of the lap than I was. I used a more progressive throttle, whereas he had almost nothing between off-throttle and full-throttle.
That’s why it’s so important to dig deep into the information you get back from the data acquisition system. In this real example, if you had taken a quick look, and made conclusions from it, you would have said that I needed to simply hold my foot flat to the floor more. While more time at full throttle may seem to make you faster, if it’s at the expense of some other benefits, perhaps it’s not actually going to be faster.
When you read your data, don’t take the first and most obvious results as the whole story. Dig deeper. Ask questions. Why does it say what it says?
Another example: If you see where you’ve had to ease up on the throttle exiting a turn, ask yourself “Why?” Then, if you have steering angle being logged by your data system, check for changes in the steering angle. Are you having to turn more (understeer), or use some counter-steer (oversteer)? If there isn’t much change in the steering angle, it might be as simple as you’re on the wrong line, aimed slightly in the wrong direction when you’re trying to go to full throttle.
Use data to help you find the whole story.
When I’m coaching a driver, the data acquisition channels that I prefer – in priority order – are:
- Speed
- Throttle position
- Brake pressure (front, rear, or combined – doesn’t matter, as I’m focused on the trend)
- Steering angle
- Lap comparison (lap vs. reference lap time)
- RPM
- Longitudinal & lateral g-force
There are others that I like to use, but these are my favorites – the basics – for analyzing how a driver is doing. I know other coaches might have a different set of priorities, so this is not cast in stone. But it works best for me when I’m helping a driver. Maybe they’ll help you…
Check back here often for more tips and advice for performance drivers, race drivers, high performance driving instructors, and anyone else interested in learning to get around race tracks quickly.
Please do me favor and share this now with others who you think would either learn something from it, or enjoy it, by clicking on any of the links below. Thank you!
Some of the most interesting stuff I learned from my data logger was from linking video to the data. e.g. I did a lap at Watkins Glen that was .5 sec faster than I had ever gone before. But how did I do it? It was in the Chute. Normally I would brake deep and take a late apex to be on the gas on exit. But the video showed that I was passing a back marker which forces me to take a shallow entry and tight apex all the way around. And that shorter distance accounted for a full half second! you’ll never know if you don’t check.
Some great insights here Ross. I do buggy cart racing (which is actually quite competitive) and I think DAQ could definitely be used to help tweek things